Solution Pattern: Solution Patterns - Optimizing Traffic and Observability with OpenShift Service Mesh 3
See the Solution in Action
1. Prerequisites
To provision the demo, you will perform the following steps, each explained in detail in the next sections:
-
You will need an OpenShift cluster with cluster-admin privileges. This solution pattern has been tested on OpenShift 4.17.
-
Ensure you have the OpenShift CLI tool
ocinstalled and the ability to run shell scripts in your local environment, such as your laptop.
1.1. CLI Tools
To check if you have the CLI tools, open your terminal and use the following command:
oc version2. Setup
In this demo, the deployment scripts use the OpenShift CLI to:
-
Install the following OpenShift Operators:
-
OpenShift Service Mesh 3
-
Kiali
-
OpenTelemetry
-
Tempo
-
-
Enable Kubernetes Gateway API.
-
Implement an OpenShift Service Mesh solution:
-
Provision and configure OpenShift Service Mesh control plane and other Istio supporting components (CRs and namespaces):
-
Istio (istiod)
-
Istio-CNI (pod networking)
-
Ingress-Gateway (for Gateway API and Istio Gateway)
-
Kiali
-
OpenShift Service Mesh Console Plugin
-
-
Provision and configure a
tracing-systemvia a TempoStack for distributed tracing:-
MinIO for persistent S3 storage
-
Tempo
-
OpenTelemetry CRs:
-
OpenTelemetryCollector
-
Telemetry
-
-
-
Monitoring Configuration:
-
Enable User Monitoring with OpenShift Observability (Prometheus).
-
Enable SystemMonitor in the
istio-systemnamespace. -
Enable PodMonitor in all Istio-related namespaces as well as application namespaces:
-
istio-system -
istio-ingress -
bookinfo -
rest-api-with-mesh
-
-
Label all Istio-related and application namespaces with
istio-injection=enabled.
-
-
Sample Applications for Demo and Use Cases:
-
bookinfo: A sample multi-service application to demonstrate OSSM observability. -
rest-api-with-mesh: A simple RestAPI application containing a front-end API that calls our back-end API, deployed via Canary deployment.
-
-
There is also a set of scripts we will use to test and deploy our RestAPI backend from v1 to v2.
2.1. Get the Deployment Scripts
-
Log in to your OpenShift cluster as cluster-admin via the OpenShift web console.
-
Click on your username in the top-right corner and select Copy login command. This will open another tab where you will need to log in again.
-
Click on the Display token link, and copy the command under Log in with this token. The command will look like this:
oc login --token=<token> --server=<server>-
Clone the following Git repository:
git clone https://github.com/bugbiteme/ossm-3-demo.git2.2. Install Operators and Enable Gateway API
Ensure you are in the top-level directory of the project: ./ossm-3-demo.
Run the following script to install the listed Operators and Gateway API, and wait for it to complete:
sh ./install_operators.sh2.3. Install OSSM Solution and Example Applications
Ensure you are in the top-level directory of the project: ./ossm-3-demo.
Run the following script to implement Service Mesh and the example applications, and wait for it to complete:
sh ./install_ossm3_demo.shExpected final output:
====================================================================================================
Ingress route for bookinfo is: http://istio-ingressgateway-istio-ingress.apps.<domain>/productpage
To test RestAPI: sh ./scripts/test-api.sh
Kiali route is: https://kiali-istio-system.apps.<domain>
====================================================================================================
3. Walkthrough Guide
How to run through the demo.
3.1. Exploring the Bookinfo Application
In this section, we will explore the example bookinfo application, which is based on the sample application found here.
bookinfo uses the Istio Gateway resource gateways.networking.istio.io, rather than Gateway API (which we will explore later).
You can access the main bookinfo page using the Ingress route shown at the end of the demo install script, or run the command:
export INGRESSHOST=$(oc get route istio-ingressgateway -n istio-ingress -o=jsonpath='{.spec.host}')
echo http://$INGRESSHOST/productpage
And open the link in a web browser.

INGRESSHOST is the URL provided by the Istio Gateway istio-ingressgateway, deployed in the istio-ingress namespace.
oc get deployment -n istio-ingress istio-ingressgateway -o yamlThis deployment represents an Istio-native Gateway deployed in the istio-ingress namespace. It handles ingress traffic into the service mesh.
The istio-ingressgateway is a gateway deployment that manages external traffic into the Istio mesh, functioning as a Kubernetes Gateway or Ingress Gateway. It uses an Envoy proxy to route requests to appropriate services within the mesh.
-
Role in Istio:
-
This deployment serves as an entry point for external traffic into the service mesh.
-
It routes requests to internal services based on
VirtualServiceandGatewayconfigurations. -
It supports load balancing, TLS termination, and traffic routing rules.
-
The Gateway resource (bookinfo-gateway) serves as a configuration for traffic routing rules, and it targets the ingress-gateway (istio-ingressgateway deployment) by matching the label istio: ingressgateway. The ingress-gateway deployment acts as the entry point into the Istio service mesh, applying these routing rules and forwarding traffic to services within the mesh.
This separation of control plane configuration (Gateway resource) and data plane traffic handling (ingress-gateway) allows for flexibility, scalability, and Kubernetes-native traffic management.
oc get gateways.networking.istio.io -n bookinfo -o yaml

apiVersion: v1
items:
- apiVersion: networking.istio.io/v1
  kind: Gateway
  metadata:
    name: bookinfo-gateway
    namespace: bookinfo
  spec:
    selector:
      istio: ingressgateway
    servers:
    - hosts:
      - '*'
      port:
        name: http
        number: 8080
        protocol: HTTP
kind: List
Another thing to look at is the namespace of the bookinfo app itself and take note of the label istio-injection
apiVersion: v1
kind: Namespace
metadata:
...
  labels:
    istio-injection: enabled
...
The label istio-injection: enabled on a Namespace is critical because it enables automatic sidecar injection for all pods deployed within that namespace. This label is a core part of Istio’s architecture and is essential for integrating services into the service mesh.
Why is istio-injection: enabled Important?
-
Automatic Sidecar Injection
-
When the
istio-injection: enabledlabel is added to a namespace, the Istio sidecar injector webhook is triggered. -
This webhook automatically injects the Envoy sidecar proxy container into each pod deployed in the namespace.
-
The Envoy proxy is responsible for:
-
Intercepting and managing inbound and outbound traffic.
-
Applying security features like mutual TLS (mTLS).
-
Enabling observability tools such as tracing and metrics collection.
-
Enforcing traffic routing rules (e.g., canary deployments, retries, circuit breakers).
-
-
-
Integration into the Service Mesh
-
Without the Envoy sidecar, the pods would not be able to:
-
Participate in the service mesh.
-
Benefit from Istio’s traffic management, observability, and security capabilities.
-
-
The
istio-injection: enabledlabel ensures that all services within the namespace are automatically onboarded into the mesh.
-
The output of oc get pods -n bookinfo shows that the Bookinfo application is running in the bookinfo namespace with multiple services and versions. The key observation here is that each pod has 2/2 containers running, indicating that Istio sidecar injection is enabled in this namespace.
oc get pods -n bookinfo

NAME                             READY   STATUS    RESTARTS   AGE
details-v1-65cfcf56f9-hfl47      2/2     Running   2          26h
kiali-traffic-generator-hv595    2/2     Running   2          26h
productpage-v1-d5789fdfb-6gs76   2/2     Running   2          26h
ratings-v1-7c9bd4b87f-8979h      2/2     Running   2          26h
reviews-v1-6584ddcf65-45q2k      2/2     Running   2          26h
reviews-v2-6f85cb9b7c-rr7kc      2/2     Running   2          26h
reviews-v3-6f5b775685-8mfwj      2/2     Running   2          26h
To get more information about the containers with in a pod, use the oc describe pod <pod name> and look in the Containers section:
Example:
oc describe pod productpage-v1-d5789fdfb-6gs7 -n bookinfo

Name:             productpage-v1-d5789fdfb-6gs76
Namespace:        bookinfo
...
Containers:
  productpage:
    Container ID: ...
    ...
  istio-proxy:
    Container ID:...
    ...
...
3.1.1. OpenShift Web Console View
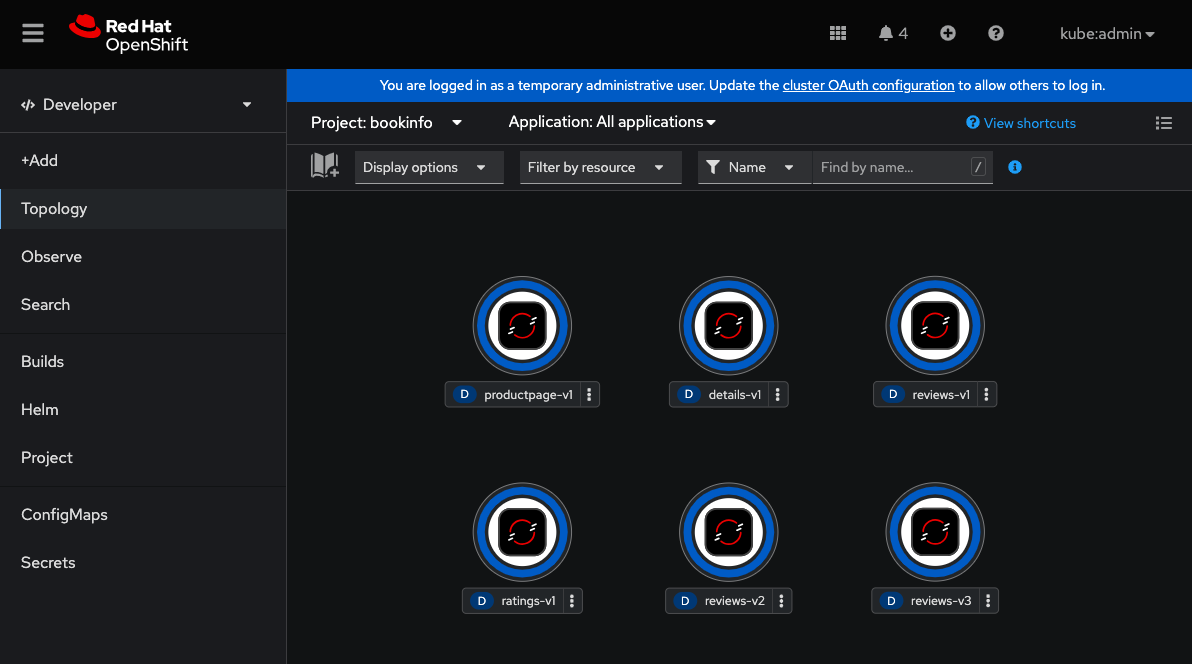
From the OpenShift web console, when looking at the topology of the bookinfo namespace, we see a number of deployments. But we really cannot see how these services interact with one another.
3.1.2. Kiali View
We can get a better view of how our services are interacting with one another when we use the Istio observability tool Kiali.
To obtain the Kiali URL, you can run the following commands:
export KIALI_HOST=$(oc get route kiali -n istio-system -o=jsonpath='{.spec.host}')
echo https://KIALI_HOST
Open this URL in a new tab and login with your OpenShift cluster admin credentials
Overview
When you initially log into the Kiali web console, you will be brought to the Overview page. This is a dashboard of all non-default projects in your cluster.
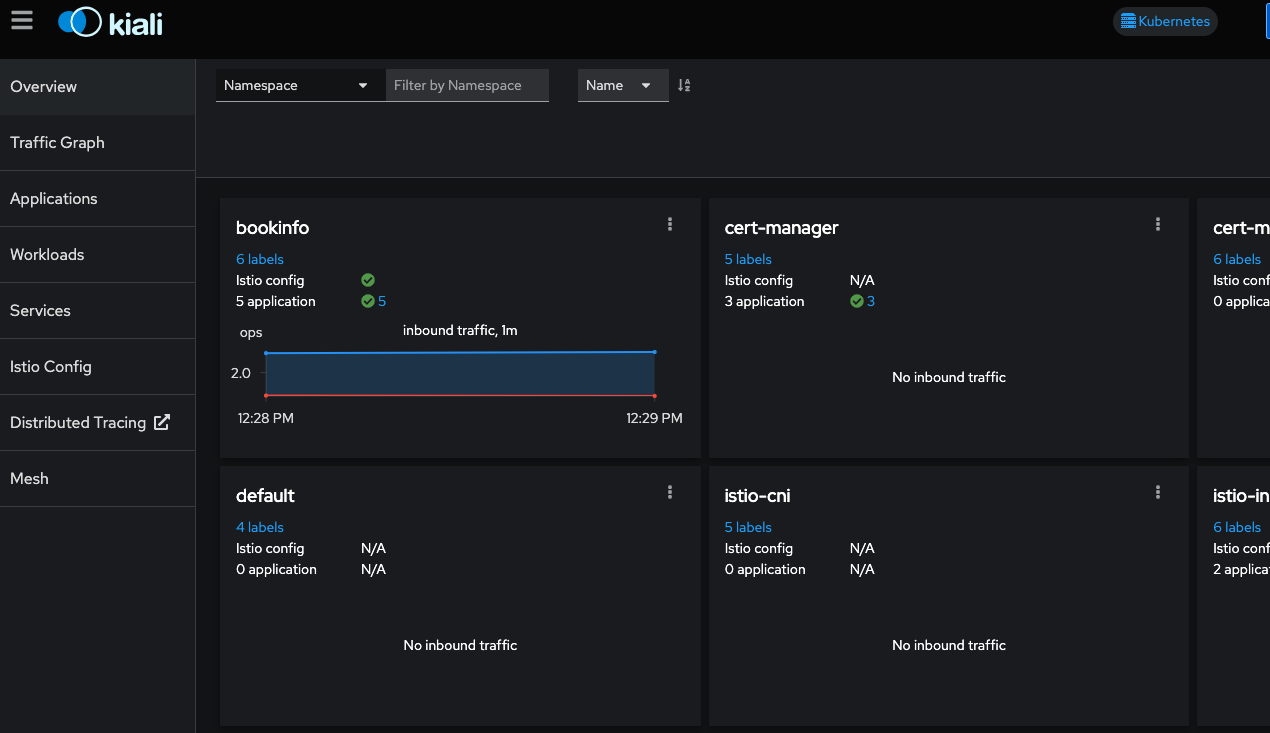
Here we can see some inbound traffic in this namespace. That is becuase we deployed a kiali-traffic-generator pod to coninuously call this application.
Traffic Graph
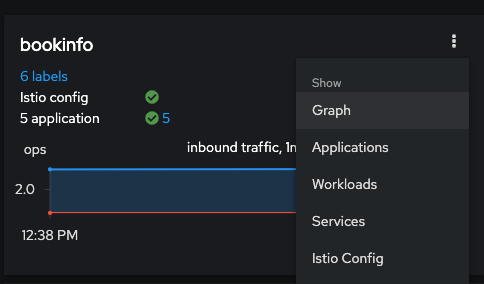
To get more ganularity on this triffic, click the three dot "kebab" menu on the bookinfo tile and select the Graph option
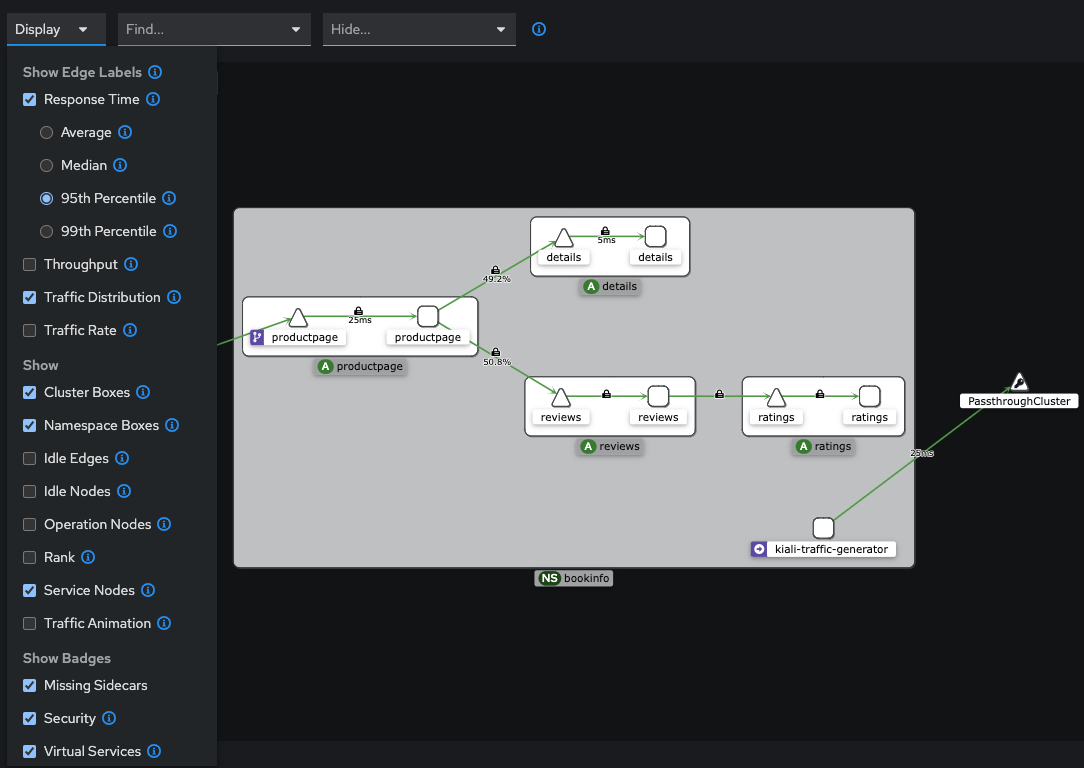
Now we can see a graphical representation of the traffic in our service mesh-enabled application. You may need to resize your screen to see the details of each bookinfo service.
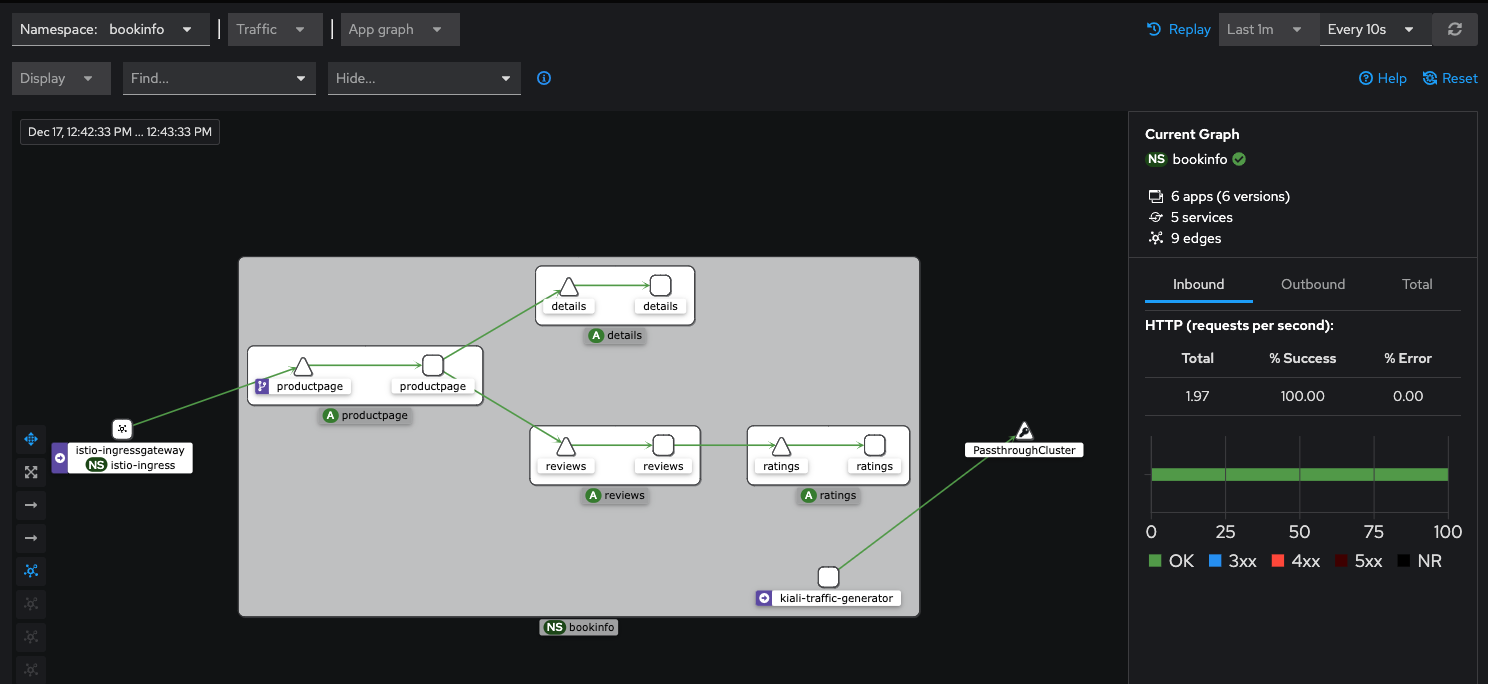
To display more metrics on the graph, use the drop-down Display menu, and check some of the metrics you want to see. Feel free to experiment.
Example:
Change the graph type to Versioned app graph to see how traffic is being disributed between the different versions of the reviews service.
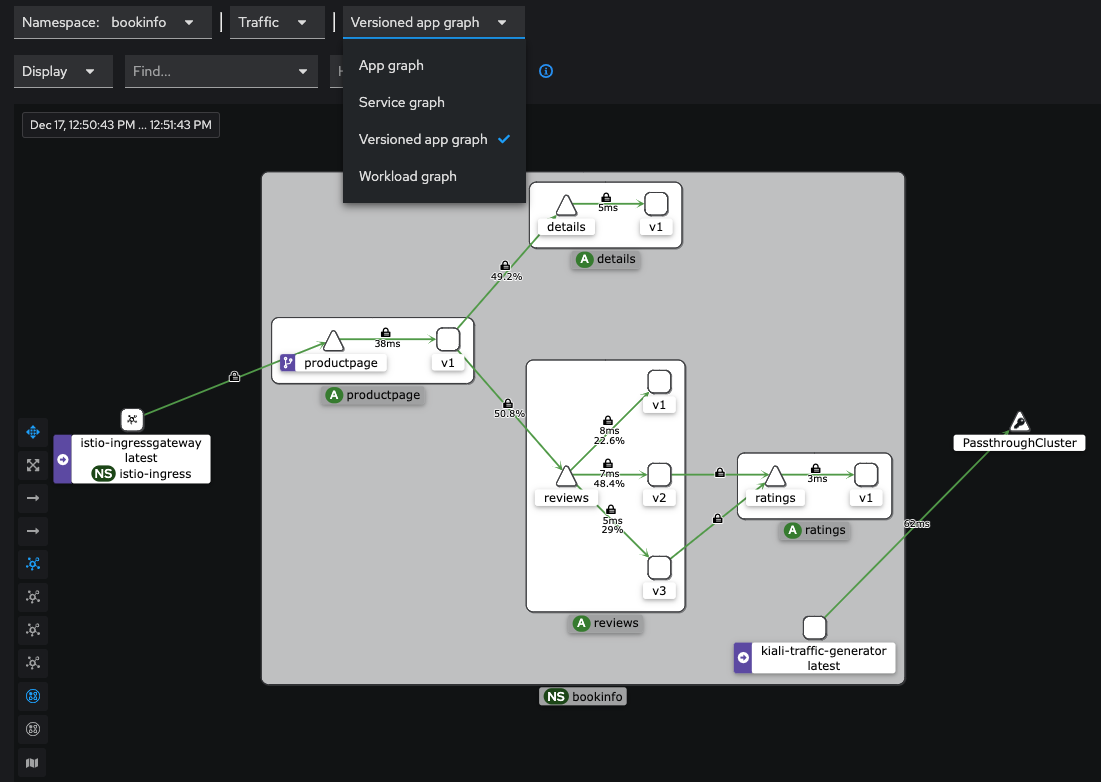
This is just a sample of the observability data we can easily interpret in the Kiali graph view. We will closer look into some of the other Kiali menu items in the next few sections.
Applications
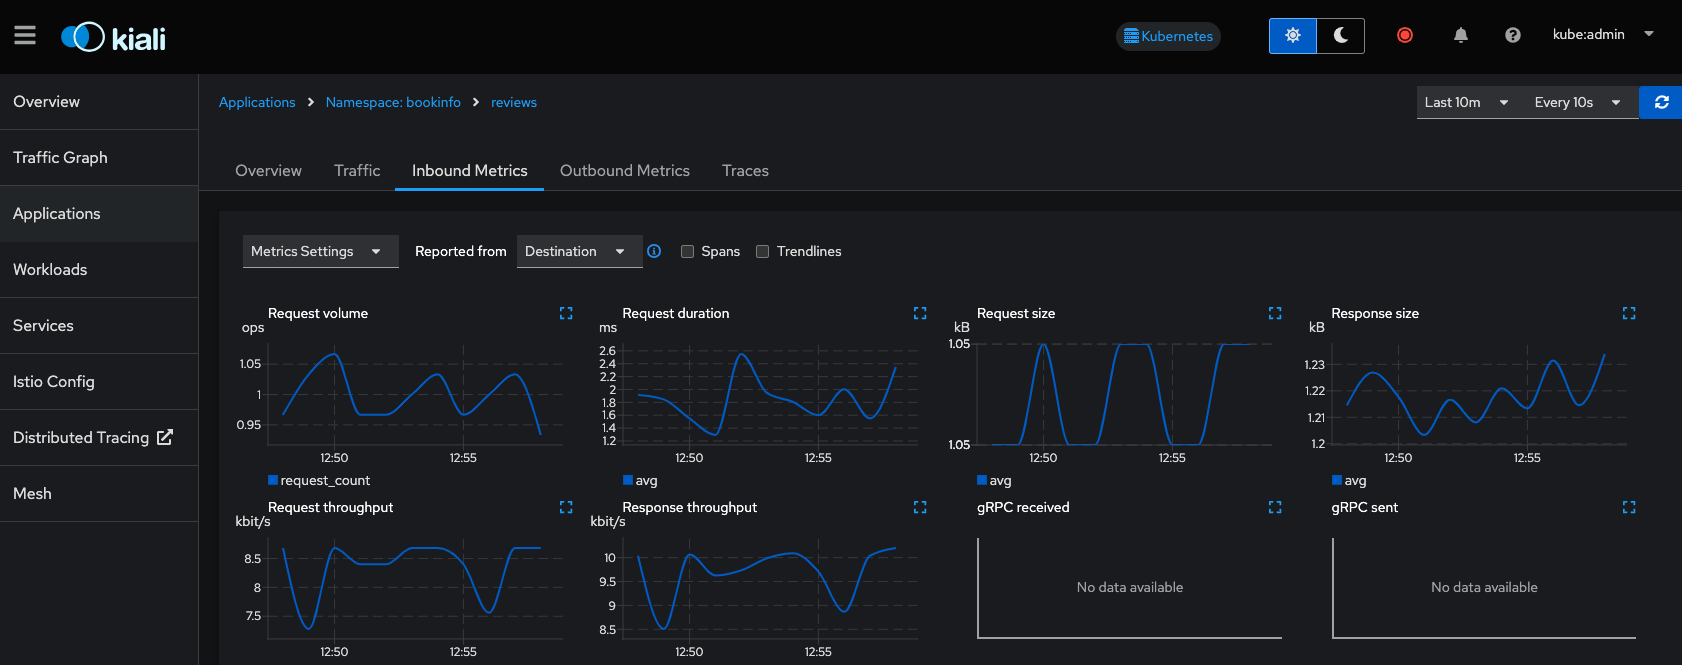
The Applications view allows us to drill down into each of the services that make up the bookinfo application, and allows us get an overview and metrics of a particular service
Workloads
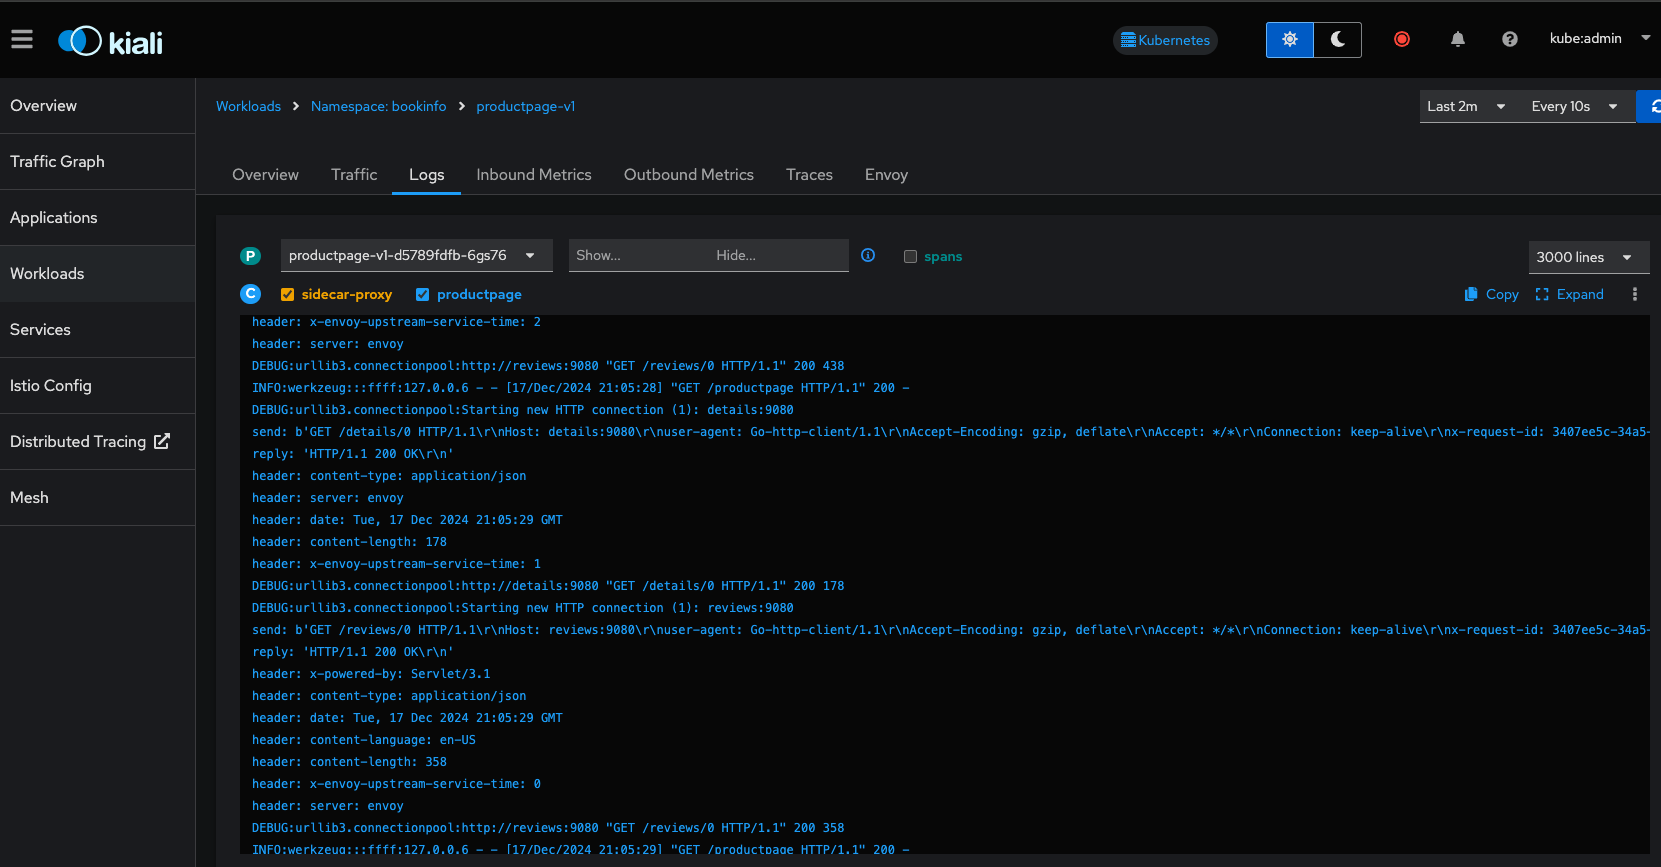
The Workloads view allows you to explore even further into each pod workload, and view similar information around metrics, as well as envoy proxy status and logs.
Services
The Services view allows you to view by kubernetes Services. Note that the front end service productpage is also associated with a VirtualService and Gateway as indicated in the Details column.

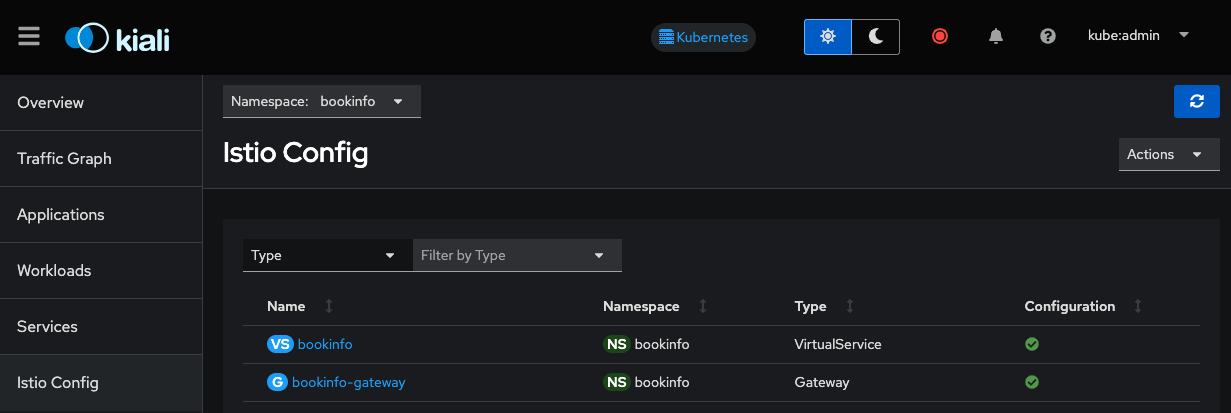
Istio Config
The Istio Config view allows us to view and modify the configuration of Istio specific resources. This comes in handy, as they are not as easy to find in the OpenShift web console.
Mesh
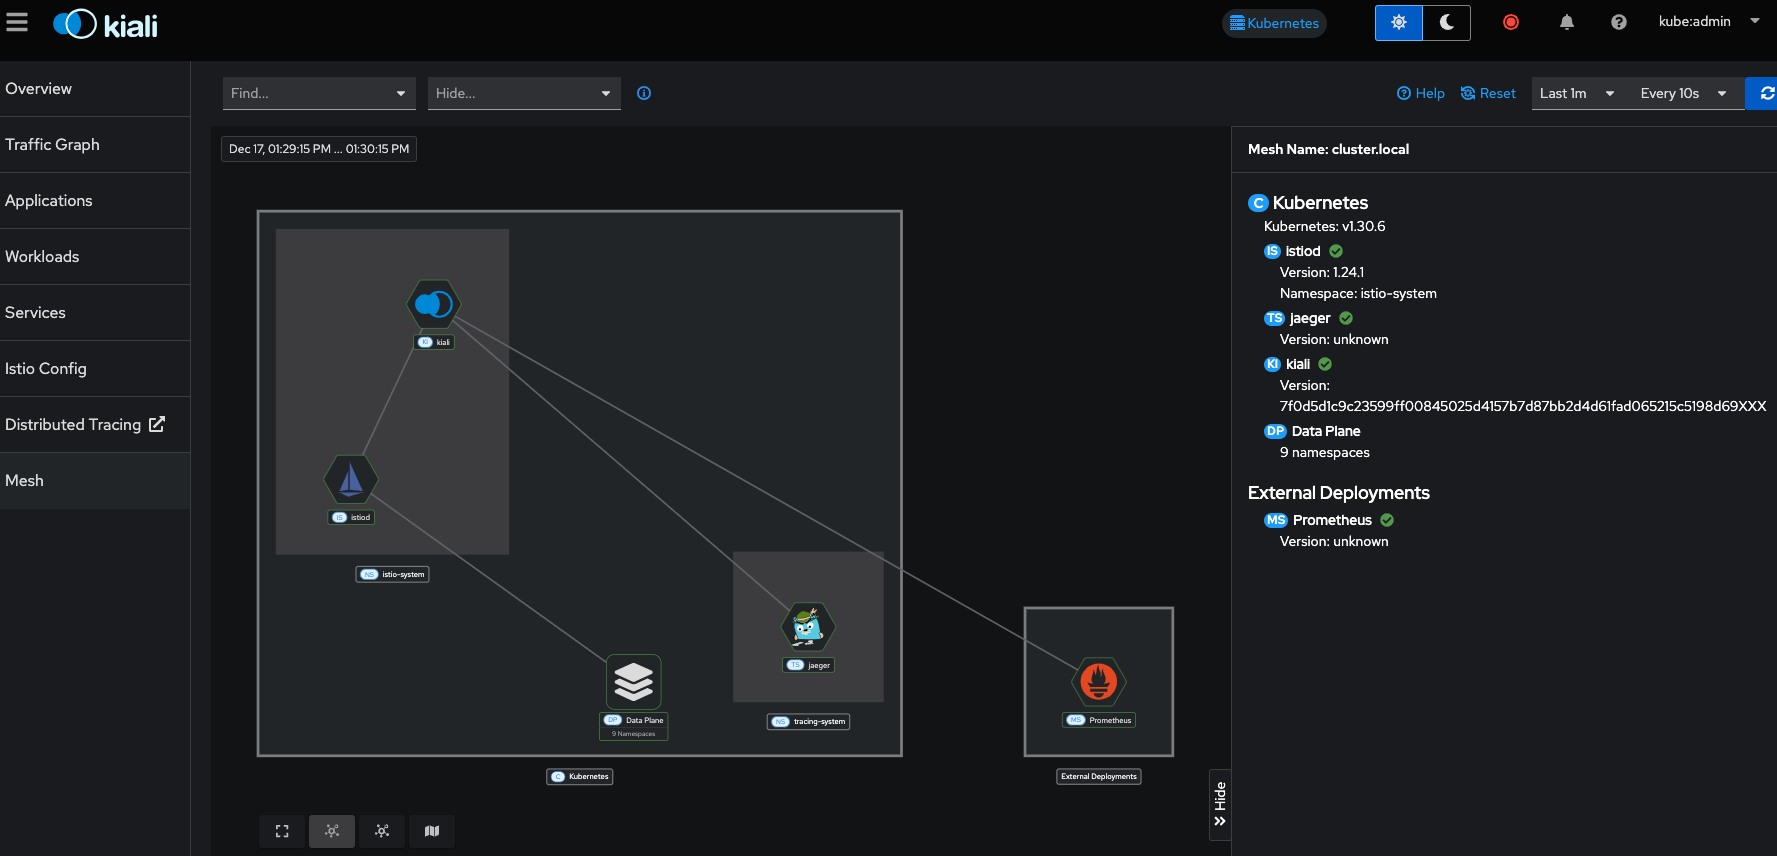
The Mesh view provides a high level view of the entire service mesh: istio-system (control plane), tracing-system (distributed tracing components), Data Plane (application namespaces), and External resources, such as Prometheus monitoring.
Distributed Tracing
The Distributed Tracing option opens up a new window (Jaeger Console). Distributed Tracing is actually handled separatly from Kiali via Tempo, and is viewable with the Jaeger web console.
|
Distributed Tracing is not covered in this Solution Pattern, but feel free to explore this console on your own. If the Distributed Tracing page does not disply properly, ensure the URL is using |
3.2. Exploring the RestAPI (rest-api-with-mesh) (Using Gateway API)
In this section we will explore the our hello-rest application, which is the application we will be using to perform our canary deployment from v1 to v2 of our backend service
This application uses the Kuberntetes Gateway API resource for ingress. image::bookinfo-01.svg[width=100%]
You can access the front end of the RestAPI using the Ingress route shown at the end of the demo install script, or run the command:
export GATEWAY=$(oc get gateway hello-gateway -n istio-ingress -o template --template='{{(index .status.addresses 0).value}}')

curl -s $GATEWAY/hello
curl -s $GATEWAY/hello-service
curl -s $GATEWAY/hello returns output from the front-end service.
`curl -s $GATEWAY/hello-service uses the front-end service to return output from the back-end service.
Before we continue, be sure to run the script
sh scripts/generate-traffic.shExample output:
❯ sh scripts/generate-traffic.sh
Tue Dec 17 14:23:23 PST 2024
{
  "response": {
    "message": "Hello World from service-b-v1"
  }
}
Tue Dec 17 14:23:25 PST 2024
{
  "response": {
    "message": "Hello World from service-b-v1"
  }
}
Tue Dec 17 14:23:26 PST 2024
{
  "response": {
    "message": "Hello World from service-b-v1"
  }
}
Tue Dec 17 14:23:27 PST 2024
{
  "response": {
    "message": "Hello World from service-b-v1"
  }
}
...
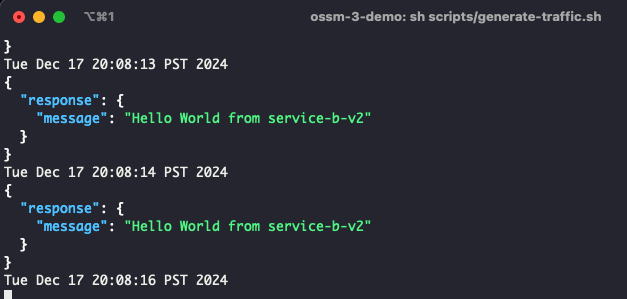
This is a loop that calls the front end RestAPI to get information from the backend RestAPI service-b-v1 every second in order to generate traffic for testing our canary deployment of service-b-v2
|
Ensure you have the |
GATEWAY is the URL provided by the Gateway API hello-gateway gateway which is deployed in the istio-ingress namespace.
Gateway API uses the GatewayClass type istio, so it requires OpenShift Service Mesh:
GatewayClass
oc get gatewayclass istio -o yaml

apiVersion: gateway.networking.k8s.io/v1
kind: GatewayClass
metadata:
  name: istio
spec:
  controllerName: istio.io/gateway-controller
  description: The default Istio GatewayClass
Gateway
oc get gateway -n istio-ingress hello-gateway -o yaml

apiVersion: gateway.networking.k8s.io/v1
kind: Gateway
metadata:
  labels:
    app: hello-gateway
    version: v1
  name: hello-gateway
  namespace: istio-ingress
spec:
  gatewayClassName: istio
  listeners:
  - allowedRoutes:
      namespaces:
        from: All
    name: http
    port: 80
As you can see, this is much cleaner than the the gateway deployment used for the bookinfo application.
We are using the Gateway API HTTPRoute to associate the front-end service with the Gateway
oc get httproute web-front-end-route -n rest-api-with-mesh -o yaml

apiVersion: gateway.networking.k8s.io/v1
kind: HTTPRoute
metadata:
  name: web-front-end-route
  namespace: rest-api-with-mesh
spec:
  parentRefs:
  - group: gateway.networking.k8s.io
    kind: Gateway # <<<< Gateway to refrerence
    name: hello-gateway
    namespace: istio-ingress
  rules:
  - backendRefs:
    - group: ""
      kind: Service # <<<< Service of the web-front-end pod
      name: web-front-end
      port: 8080
      weight: 1
    matches:
    - path:
        type: PathPrefix
        value: /
3.2.1. OpenShift Web Console View
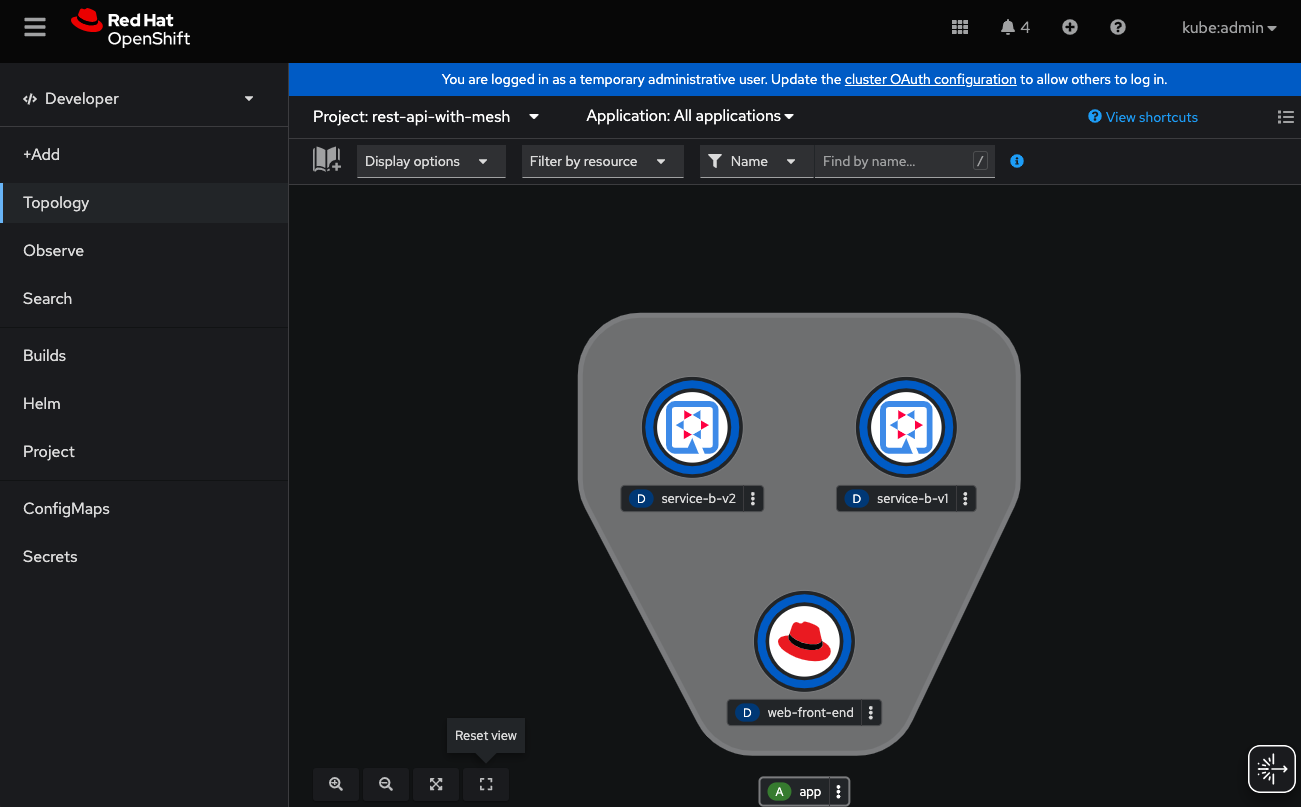
From the OpenShift web console, when looking at the topology of the rest-api-with-mesh namespace, can see the web-front-end and service-b-v1 and the newly created service-b-v2, but as we could see with our curl calls and our generate-traffic.sh script, we are only getting data back from service-b-v1.
export GATEWAY=$(oc get gateway hello-gateway -n istio-ingress -o template --template='{{(index .status.addresses 0).value}}')
curl -s $GATEWAY/hello-service
{"response":{"message":"Hello World from service-b-v1"}}
3.2.2. Kiali View via The OpenShift Service Mesh Console Plugin (OpenShift Web Console)
This time, instead of using the Kiali Web Consle, we will observe our service mesh with the OpenShift Service Mesh plugin, which is included with Kiali.
In the Administrator view in the OpenShift Web Console, on the left hand menu, scroll down and select Service Mesh → Traffic Graph.
With sh scripts/generate-traffic.sh continuing to run in a terminal, go to the Traffic Graph Kiali menu and select the rest-api-with-mesh namespace.
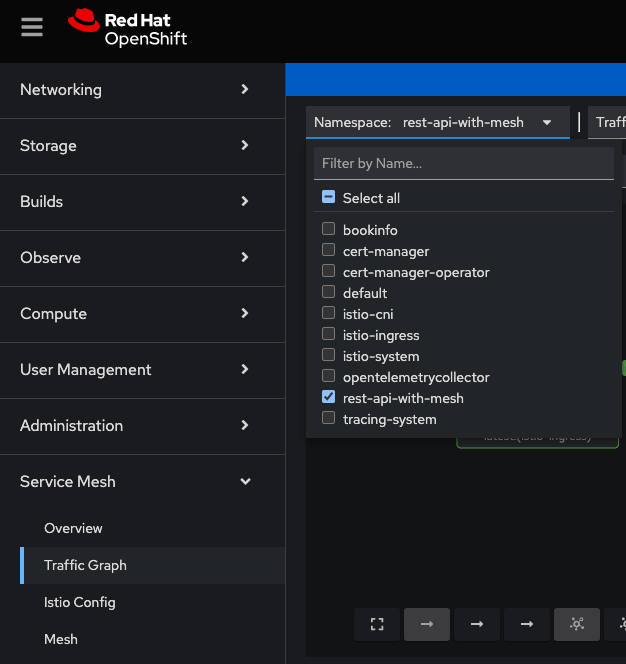
For the Display options, select:
-
Traffic Distribution -
Idle Nodes -
Security -
Traffic Animation(optional, but helpful)
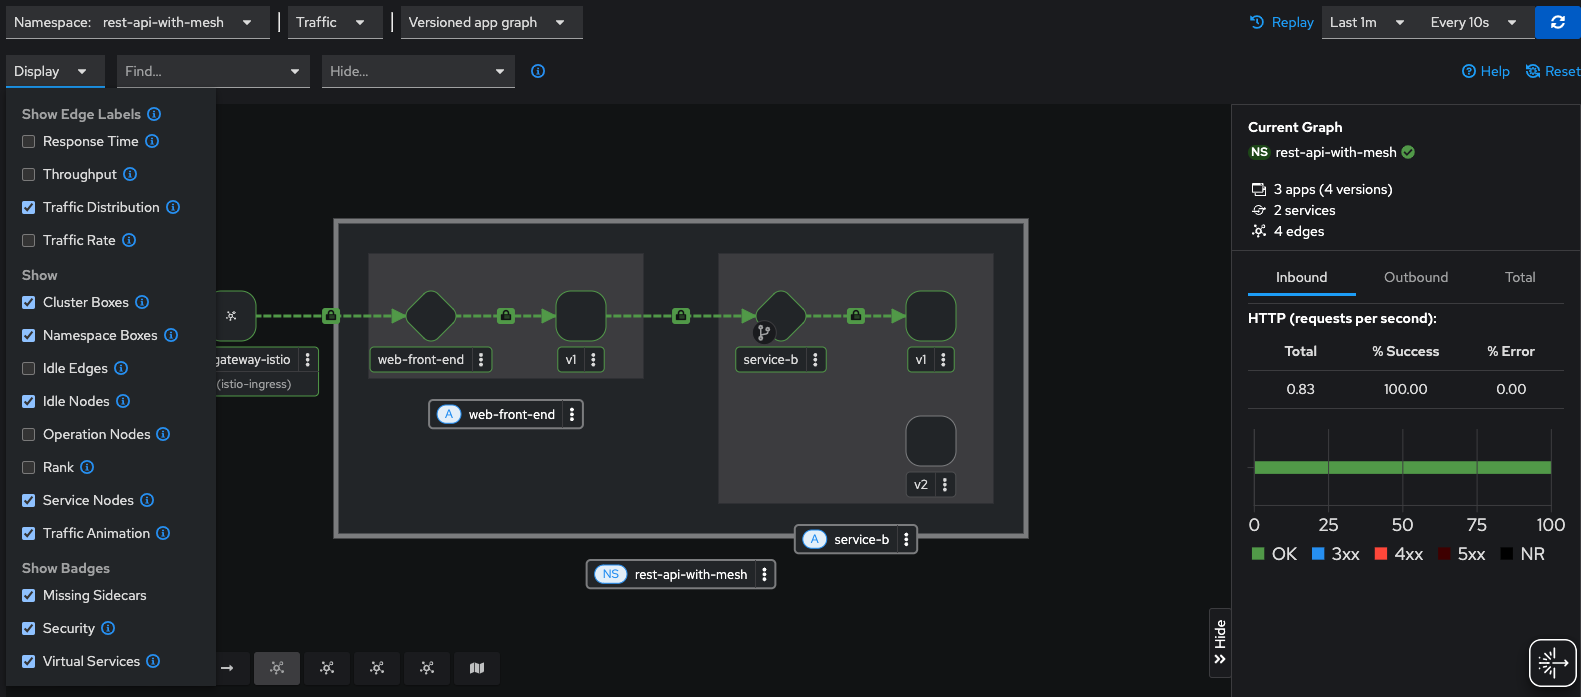
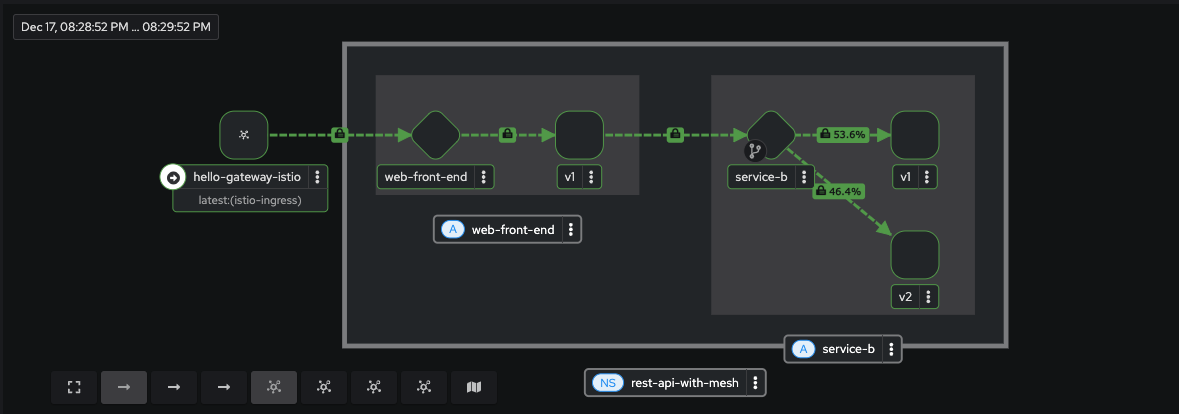
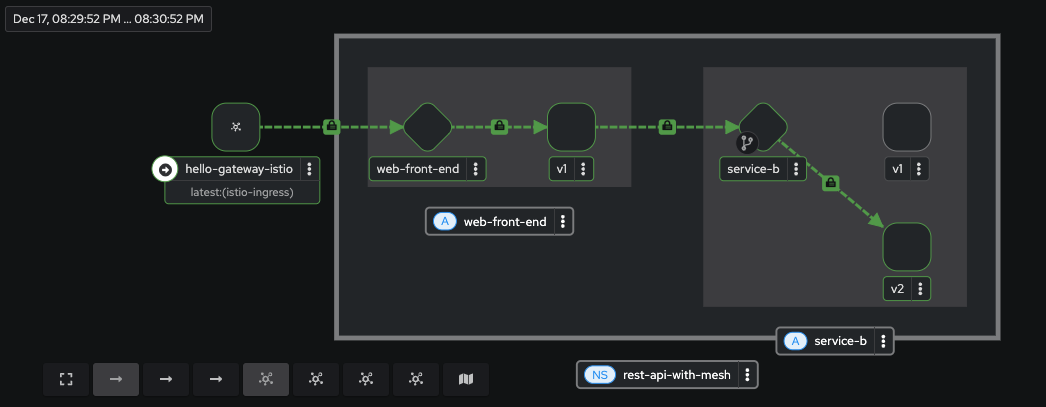
Now we can clearly see the flow of traffic through the Gateway to our backend service, and as we can also observe, all traffic is being routed to v1 of service-b.
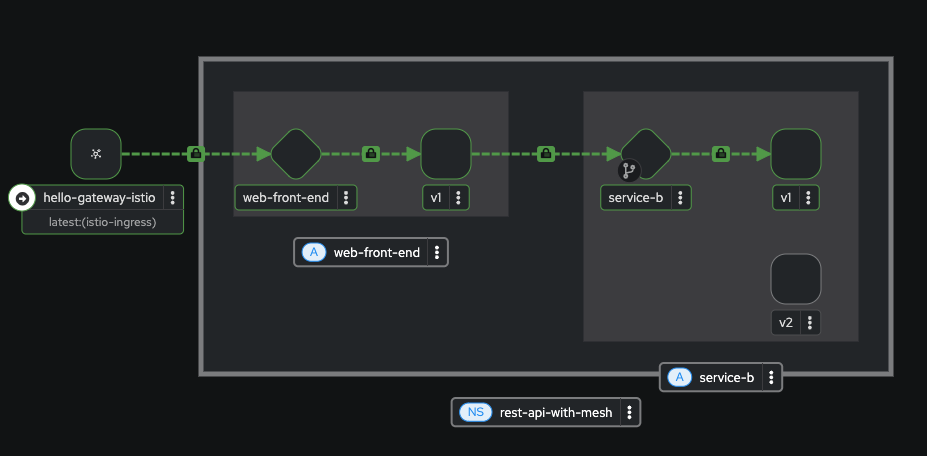
Keep this browser window open while sh scripts/generate-traffic.sh continues to run in a terminal for the next section.
Also set the replay to 1 minute and refresh every 10 seconds. This will give us a view of our Kiali traffic in slight-delayed "real-time".

3.3. Performing a Canary Deployment (rest-api-with-mesh)
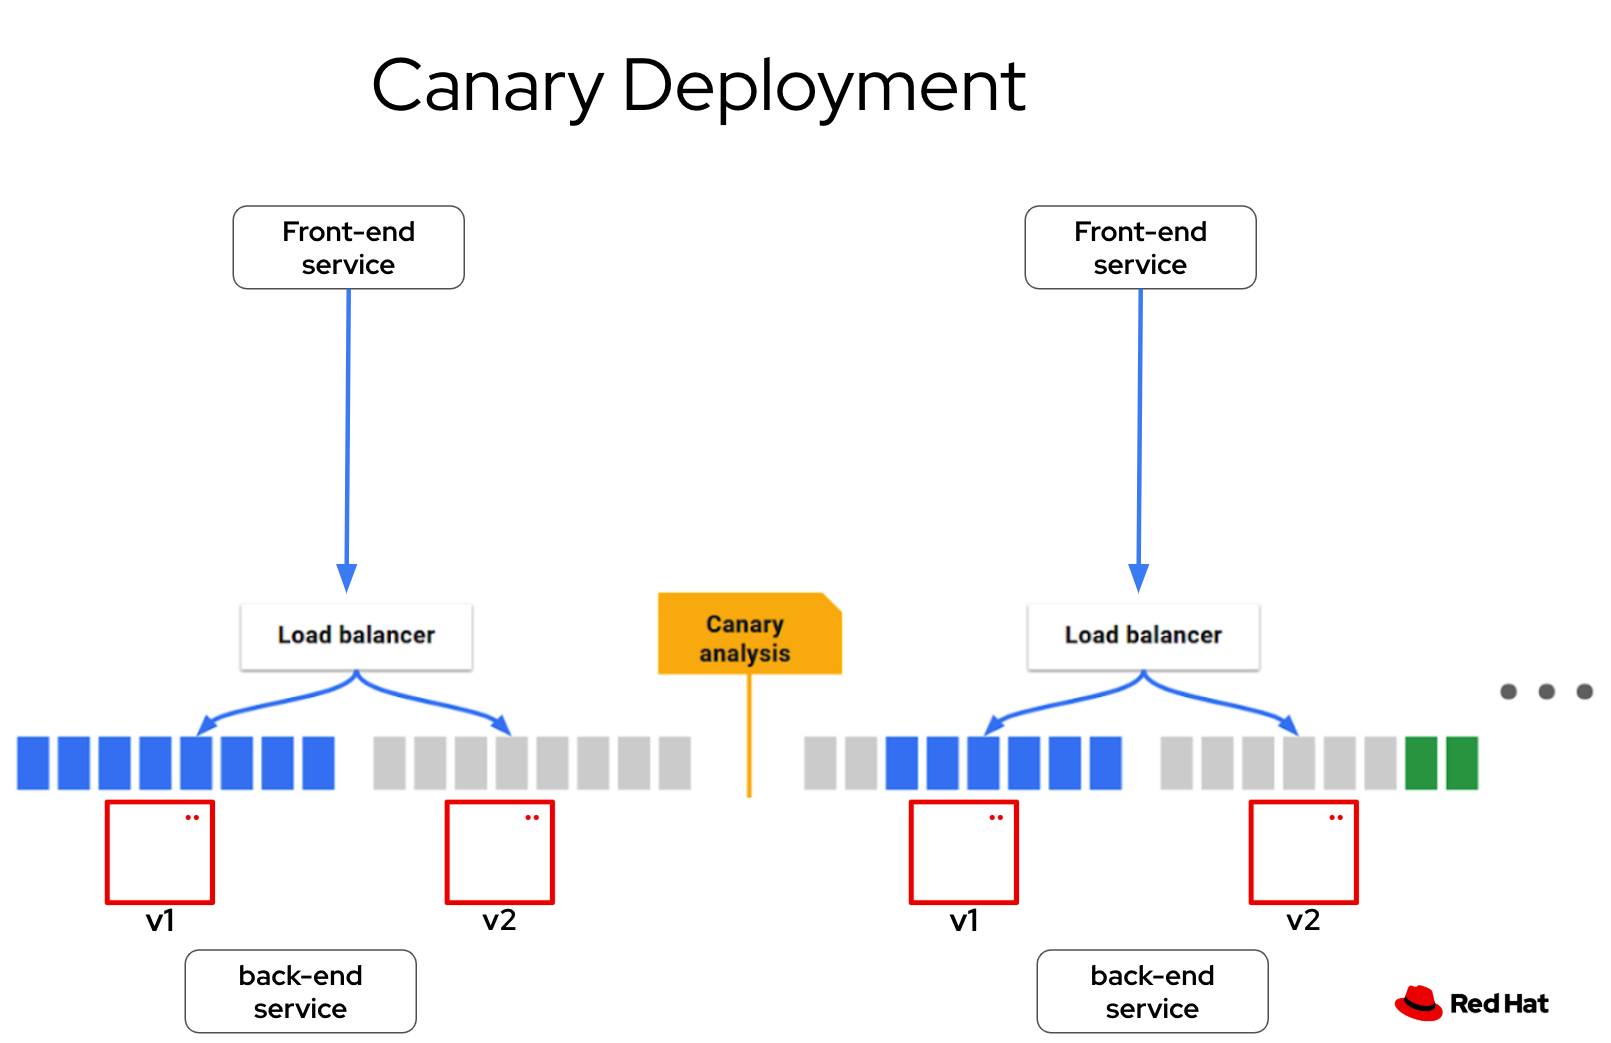
A canary deployment is a strategy where a team releases a new version of their application to a small percentage of the production traffic. This small percentage can test the new version and provide feedback. If the new version is working well, the team can increase the percentage, until all the traffic is using the new version.
For this solution pattern, we will be using a script to automate the canary deployment. Other DevOps tools, such as Argo Rollouts and Ansible are commonly used to automate canary deployments with Service Mesh as well.
In OpenShift Service Mesh, a canary deployment can be implemented using the VirtualService resource. A VirtualService allows you to define traffic routing rules for your services, enabling granular control over how requests are distributed between different versions of an application.
Here’s how a canary deployment works with a VirtualService in OpenShift Service Mesh:
-
Deploy Multiple Versions of Your Application
-
Ensure the new version of your application is deployed alongside the current version.
-
For example, deploy
service-b-v1andservice-b-v2as separate deployments in OpenShift.
-
-
Define a
VirtualService-
A VirtualService is created to control how traffic is routed between
v1andv2of theservice-b`service. The traffic split is defined using weights for each version.
-
Here’s an example of a VirtualService that implements a canary deployment for the service-b` service:
apiVersion: networking.istio.io/v1
kind: VirtualService
metadata:
  name: service-b
  namespace: rest-api-with-mesh
spec:
  hosts:
  - service-b
  http:
  - route:
    - destination:
        host: service-b
        port:
          number: 8080
        subset: v1
      weight: 100
    - destination:
        host: service-b
        port:
          number: 8080
        subset: v2
      weight: 0
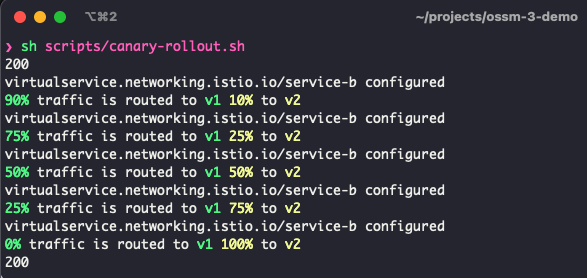
In it’s current state, the VirtualService is has a weight of 100% routing traffic to v1 and 0% to v2. We will use our deployment script to change these weights in small increments until traffic is weighted at 100% to v2
Let’s kick this off now!
Open a second terminal and open it side-by-side with your terminal running the generate-traffic.sh script. Also be sure that you can view your web console (either on the same or second screen).
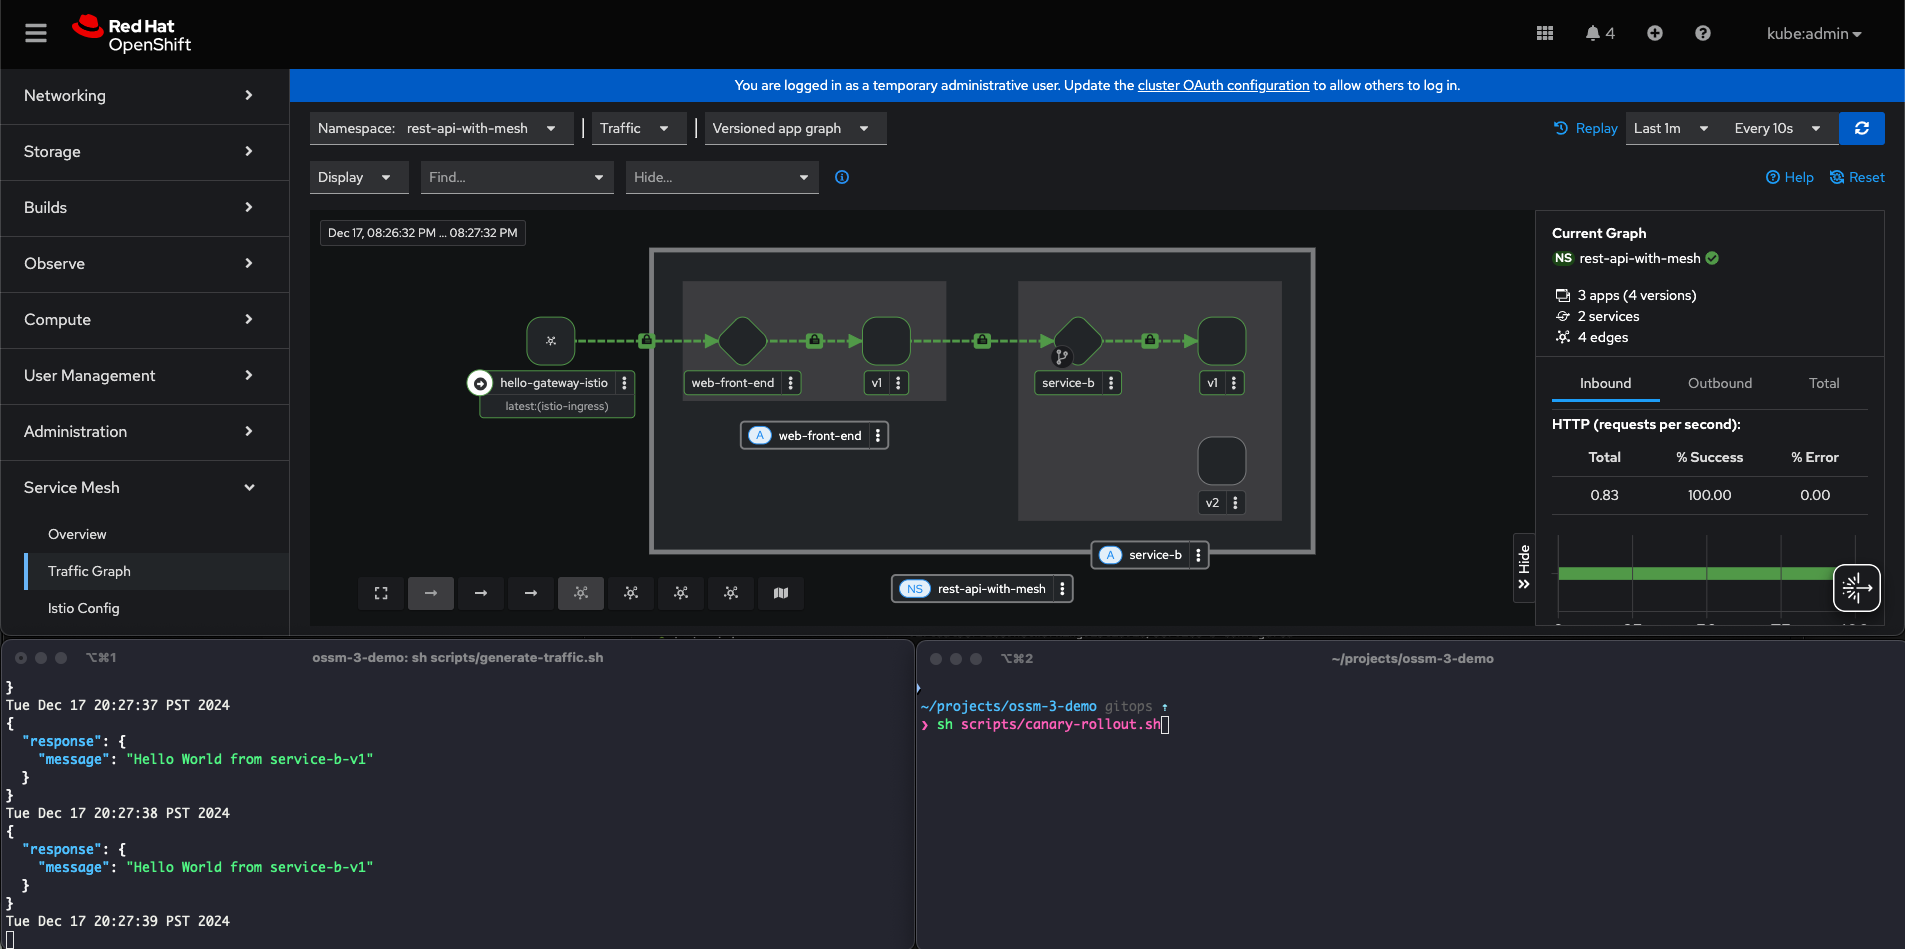
(Above: Example screen layout)
In the second terminal, run the script canary-rollout.sh
sh scripts/canary-rollout.shIn this terminal you will see updated ttraffic weights between v1 and v2, while in real time, output from the traffic-generator.sh script will start displaying responses from service-b-v2.
The Kialy terminal will show updated progress as well, but keep in mind the data seen is 1 minute in the past, but still makes for a useful visualization.
If you would like to roll traffic back to v1, run the command:
oc apply -k ./resources/application/kustomize/overlays/pod4. Summary
This solution pattern demonstrates a comprehensive approach to implementing OpenShift Service Mesh with practical use cases such as bookinfo and rest-api-with-mesh. Key takeaways include:
-
Properly setting up prerequisites and deploying OpenShift Service Mesh Operators and Gateway API.
-
Leveraging Istio’s capabilities to manage traffic routing, observability, and distributed tracing.
-
Using
TempoStackfor distributed tracing with integrations like OpenTelemetry. -
Deploying and exploring example applications (
bookinfoandrest-api-with-mesh) to demonstrate Service Mesh features. -
Performing advanced deployment strategies, such as canary deployments, to manage application releases efficiently.
By following this guide, users can gain hands-on experience with OpenShift Service Mesh and its components, enabling better understanding and adoption of these technologies in real-world scenarios.